Following a downturn in August, the Houston housing market found its footing in September, demonstrating stability with a return to positive sales territory as prices and inventory levels remained steady. However, the Houston real estate market, like the national market, appears to be in a wait-in-see mode with one eye on the mortgage market and another on the upcoming presidential election.
Key Highlights from the Houston Association of Realtors (HAR) September 2024 Market Update:
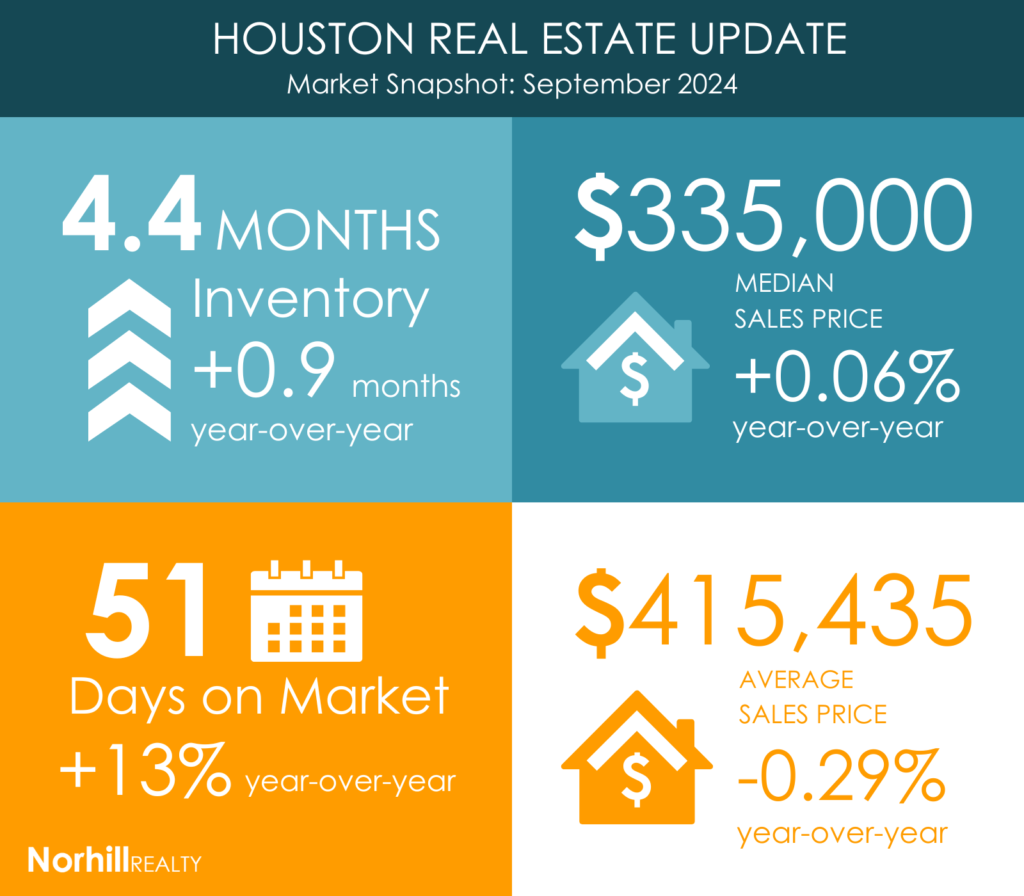
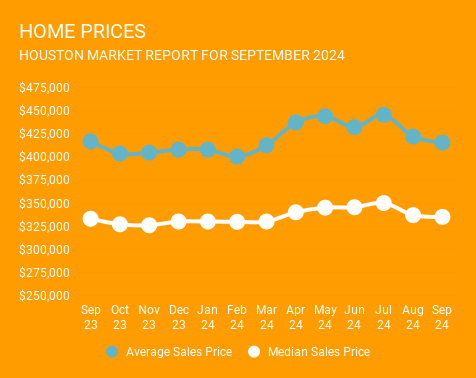
Home Prices: Home prices showed signs of stabilization; the average price remained nearly flat year-over-year at $415,435, and the median price saw a slight increase of .06% to $335,000.
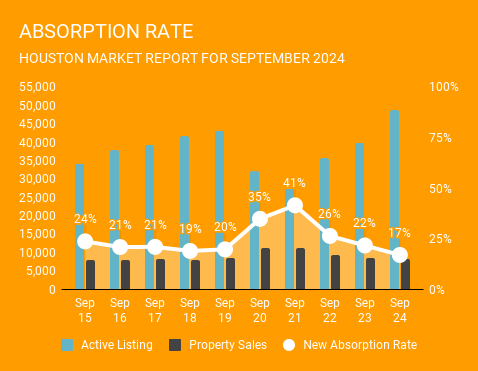
Likely to Sale: According to HAR, total active listings, or the total number of available properties, increased 25% to 48,749. September sales of all property types totaled 8,228 down 3.3%compared to September 2023.
As a result, the absorption rate, which is a measure of any given home’s likelihood to sell, for September 2024 was 17%. This is slightly under the 18% absorption rate we saw last month. Single Family Home sales performed much better, seeing a 23% absorption rate in the month of September.
Market Segments: The most significant sales growth occurred in homes priced between $250,000 and $499,999, representing 59.7% of all home sales with a 4.2% increase. The luxury market ($1 million+) followed with a 2.0% rise, while the segment below $100,000 also saw a 3.5% increase.
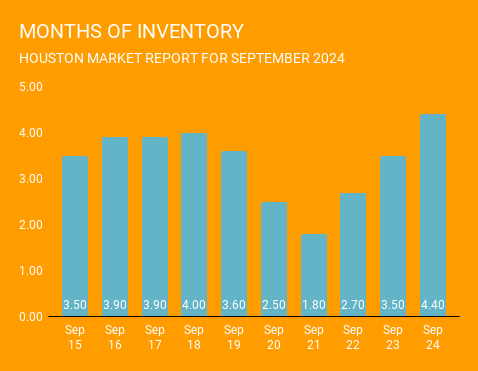
Inventory: Inventory expanded to a 4.4-months supply, unchanged from the previous month and marking the highest level since September 2012. Housing inventory nationally stands at a 4.2-months supply, according to the latest report from the National Association of Realtors (NAR). A 4.0- to 6.0-months supply is generally considered a “balanced market” in which neither buyer nor seller has an advantage.
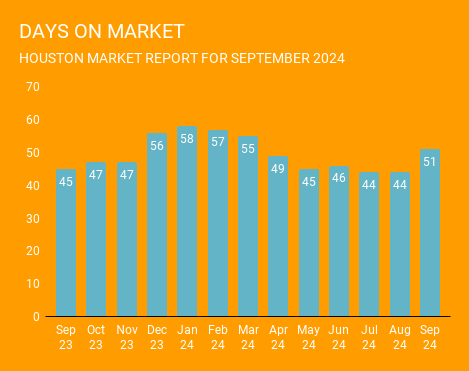
Days on Market: After being pretty stable for the past 4 months, the speed at which homes go under contract spiked a bit. Days on market were up to 51 days last month.
Single-Family Homes Update:
Single-family home sales saw a modest increase, with active listings up 28.1% from last year, providing more options for buyers. The market’s days on market increased, indicating a slower pace of sales, yet the pricing remained relatively stable, which could attract buyers who have been sidelined due to previous high rates.
Townhouse/Condominium Trends:
The townhome and condominium market continued to face challenges with a significant drop in sales and a rise in inventory. However, the average and median prices increased considerably, suggesting that despite lower sales volumes, market values are holding up.
Looking Ahead:
With stable prices, rising sales in key segments, and a continued increase in inventory levels, Houston’s housing market is poised to accommodate the goals of both buyers and sellers. These conditions are expected to foster a healthier market environment as we move into the final quarter of the year. Recent drops in mortgage rates and the coming end of the presidential election could bode well for the late fall and 1st quarter of 2025. Home Prices went up after 7 of the last 8 presidential elections.
For a comprehensive overview and expert advice, consider connecting with Norhill Realty to navigate these trends effectively. Fill out the form to get started.
[vr_column size=”1/2″ center=”yes”]
[vr_note note_color=”#FFFF66″]
GET MATCHED WITH AN AGENT
[/vr_note]
[/vr_column]

