Houston’s real estate market is hinting at a “soft landing” this August. Even with some indicators pointing downwards, the local housing landscape is showing a shift towards more typical seasonal trends. This is happening despite consumers’ concerns over rising interest rates and home prices. The Houston market has proved to be pretty resilient as it settles into a normal pattern.
Norhill’s Key Insights from the Houston Association of Realtors (HAR) August 2023 Market Update:
Single-Family Home Sales: Sales decreased by 3.8% year-over-year, marking a decline for the 17th consecutive month. However, with 7,983 units sold in August 2023 compared to 8,301 in August 2022, this decline is the smallest since May 2022. When set against pre-pandemic figures from August 2019, sales were down by 8.0%.
Luxury Home Sales: Homes priced at $1 million and above, which make up 3.7% of the market, were the only segment to see an increase in sales.
Townhouse/Condominium Sales: This segment saw a 19.0% decline year-over-year in August, marking the 15th consecutive monthly drop. The average price increased by 2.7% to $260,909, while the median price rose by 3.2% to $225,000.
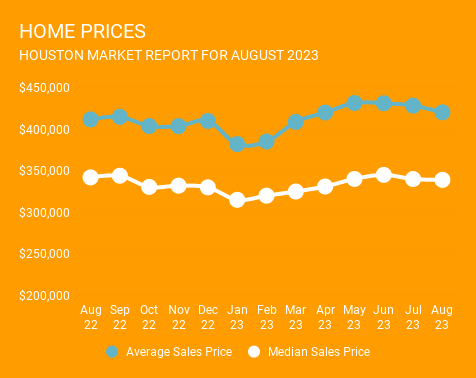
Home Pricing: The average price of single-family homes increased slightly by 2.5% to $420,124. The median price remained stable at $339,000, staying below the record highs observed in 2022.
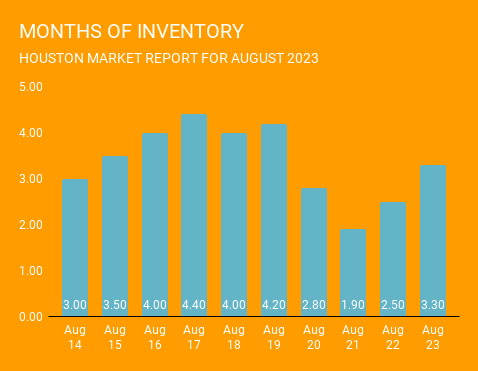
Inventory Levels: August saw a 3.3-months supply, matching the highest level since May 2020. This aligns with the national average, as reported by the National Association of Realtors (NAR).
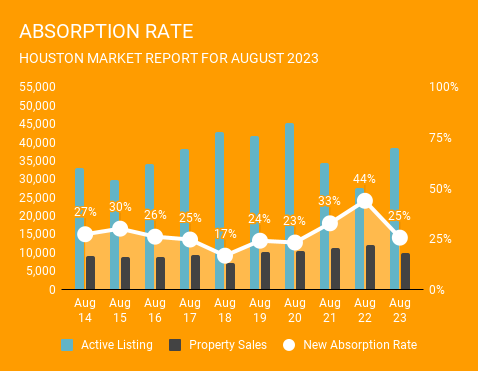
Likely to Sell: According to HAR, total active listings, or the total number of available properties, increased 14.8 percent to 38,439. August sales of all property types totaled 9,780 down 4.3 percent compared to August 2022. As a result, the absorption rate, which is a measure of any given home’s likelihood to sell, for August 2023 was 25 percent. When compared to last month and Augusts over the past 10 years, this is a pretty healthy absorption level, which should continue to help stabilize prices.
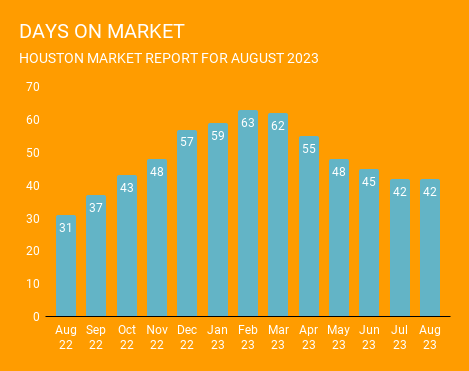
Days on Market: The time it took to sell a home has been relatively flat over the past 3 months. Days on market for August was 42 days, which is exactly what we saw last month.
Inventory in the Houston real estate market has increased in recent months, but the market remains stable. Relatively low inventory should continue to drive prices upward, which will be welcome for home sellers. On the flip side, buyers will benefit from fewer multiple-offer scenarios and a broader selection of homes. Additionally, with oil prices nearing $100/barrel, we could see increased market activity in the coming months.
Connecting with a local realtor can provide valuable insights tailored to your needs and contacting one of Norhill’s amazing Realtors is a good place to start. They can guide you through the market trends in your desired neighborhoods and advise on the best times to buy or sell. Fill out the form to get started.
[vr_column size=”1/2″ center=”yes”]
[vr_note note_color=”#FFFF66″]
GET MATCHED WITH AN AGENT
[/vr_note]
[/vr_column]
Find and click your neighborhood below to find the latest listings and local market data for these great Houston neighborhoods. |
|
| Afton Oaks / Highland Village Bellaire Briargrove Briargrove Park / Walnut Bend Brooke Smith Camp Logan / Glen Cove Cottage Grove Downtown EADO / Eastwood Sawyer Heights / First Ward Art District Garden Oaks Houston Heights Knollwood / Woodside Memorial West Meyerland Area |
Midtown Montrose Oak Forest Mangum Manor / Oak Forest West Rice Military / Washington Corridor River Oaks Shopping Area Shady Acres Shepherd Plaza Park Spring Branch Spring Valley Timbergrove / Lazybrook University Place / Museum Park Westbury / Maplewood / Brays Oaks West University / Southside Willow Meadows / Willowbend |