Mortgage rates have been up and down the last few months1, but the Houston real estate market demonstrated remarkable resilience in October. Both home sales and inventory levels increased, indicating a robust and active market as we entered the final quarter of 2024. With the HAR.com online traffic and home tours on the rise2, we could be looking at a strong start in 2025.

Key Highlights from the Houston Association of Realtors (HAR) October 2024 Market Update:
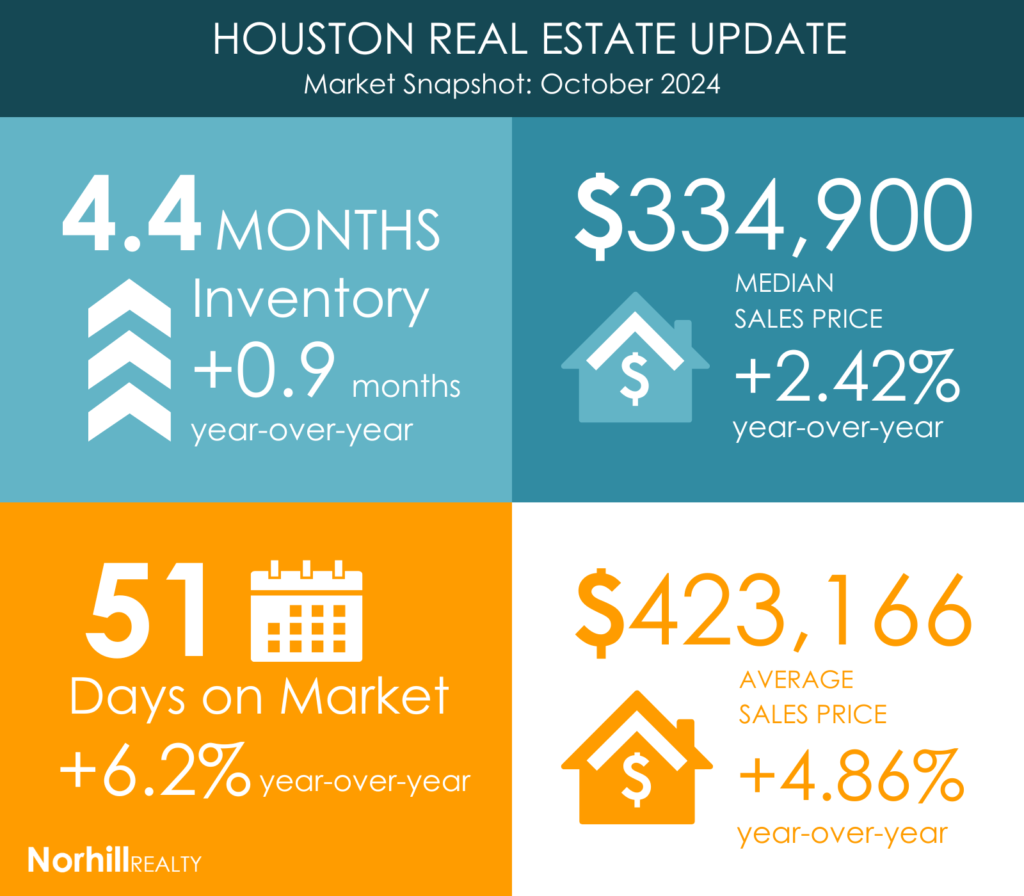
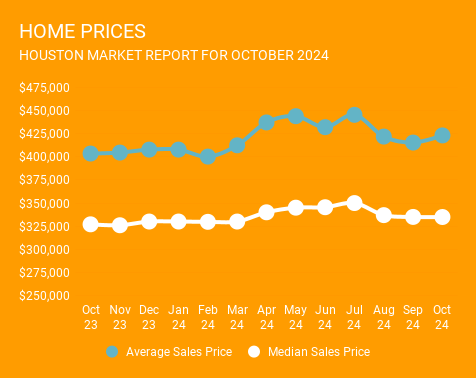
Home Prices: The average home price rose by 5.2% to $423,166, and the median price increased by 2.7% to $334,900.

Likely to Sale: According to HAR, total active listings, or the total number of available properties, increased 23.5 percent to 49,423. October sales of all property types totaled 8,627 down 10.2 percent compared to October 2023.
As a result, the absorption rate, which is a measure of any given home’s likelihood to sell, for October 2024 was 17 percent. This is the exact same play we were last year. We have a few more homes on the market, but buyers are keeping up with supply.
Market Segments: The luxury market ($1 million+) led the way with a 33.8% increase in sales. The $500,000 to $999,999 segment also saw significant growth with a 25.9% increase in sales, while the segment priced between $100,000 and $149,999 experienced a 7.3% decline in sales.
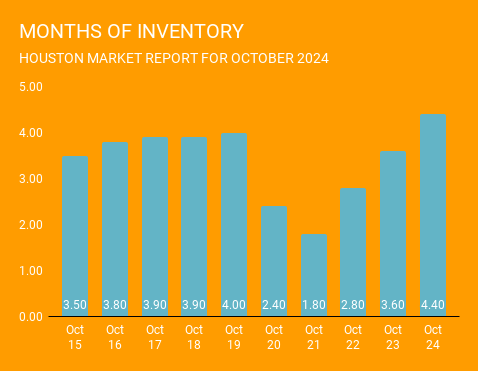
Inventory: Inventory levels expanded from a 3.5-months supply last October to 4.4 months, the highest since September 2012. Housing inventory nationally stands at a 4.0-months supply, according to the latest report from the National Association of Realtors (NAR). A 4.0- to 6.0-months supply is generally considered a “balanced market” in which neither buyer nor seller has an advantage.
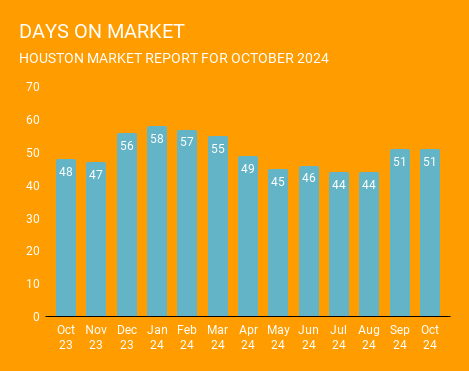
Days on Market:
Days on market has remained pretty stable over the past 2 months and are only slightly higher than October 2023.
October Monthly Market Insights:
The Houston market saw an end to a five-month trend of declining total property sales, with a 10.2% increase in sales compared to last year. Total dollar volume also rose by 19.5% to $3.5 billion, and the number of available properties was 23.6% higher than in October 2023, reflecting a more dynamic market environment.
Single-Family Homes Update:
October marked a significant rebound in single-family home sales, continuing the positive trend for the second consecutive month. The price per square foot increased slightly, and active listings saw a substantial rise, offering more options to prospective buyers.
Townhouse/Condominium Trends:
For the first time since October 2022, townhome and condominium sales entered positive territory with a 6.5% year-over-year increase. While the median price saw a slight decline, the average price increased, reflecting ongoing interest in these property types.
Looking Ahead:
The Houston housing market is showing signs of sustained activity despite economic uncertainties, supported by favorable mortgage rates and a healthy increase in inventory. This balanced market environment is likely to continue providing opportunities for both buyers and sellers as we approach the year’s end. History has shown that home prices tend to rise in the year following a presidential election, with increases in seven of the last eight post-election years3.
To receive more market updates like this one on a monthly basis, fill out the form below.
[vr_column size=”1/2″ center=”yes”]
[vr_note note_color=”#FFFF66″]
SIGN UP FOR OUR MONTHLY NEWSLETTER
Oops! We could not locate your form.
[/vr_note]
[/vr_column]


